


Calculating a Net Promoter Score (NPS) or similar numerically based surveys for your business is easy because numerical data is easy to add, average, and summarize. These can be easily calculated and averaged to create benchmarks and measure business growth. When you throw qualitative data (non-numerical feedback) into the mix, however, it’s less easy to analyze and summarize on its own without a customer feedback management platform or detailed, manual summary analysis of the data.
This is why developing a system for coding qualitative data, so it’s numbers or category-based, is helpful. Once quantified, this data can be used to interpret things like interview answers, reviews, and comments into meaningful, actionable results.
In this guide, we discuss coding qualitative data, including:
- What is qualitative data?
- What is data coding in qualitative research?
- Steps for a qualitative data analysis
- How do you code qualitative data in Excel?
- Bonus tips for quantifying qualitative data
- What is the fastest way to code qualitative data?
Contents
What is qualitative data?
Qualitative data is non-numerical data feedback. It comes from written, audio, or imagery responses. Here’s an example of how the same question can be asked in 2 different ways, resulting in qualitative data and quantitative data:
- Qualitative: Tell us about your satisfaction with our software.
- Quantitative: Rate your satisfaction with our software on a scale from 1-10.
Most surveys will ask both qualitative and quantitative questions to collect more detailed data. And while it provides helpful, detailed information, the qualitative data analysis is not as quick to summarize and analyze afterwards without being quantified in some way, whether that be by manual analysis or using customer insight software. This is why brands are using qualitative data coding to better understand customer feedback.
Types of qualitative research
There are many types of qualitative research methods. Here are six popular ways to collect the qualitative data from your customers:
Interviews
In interviews, you ask the respondent open-ended questions and record their answers. These often require a more personal approach and are best performed by a third party to avoid hesitation or biased responses.
Focus Groups
In group settings, limit focus groups to six to ten people and use a third-party moderator for transparency.
Record Keeping
Look for other sources of information to use in your qualitative data analysis. This could include customer records, purchase history, and other customer data you have legally obtained or collected.
Observation
This is when you or a third party observes your customers using the product and records what they observe (either by writing down or recording video or audio). Ethically, the customers should know they are being observed and for what purpose.
Longitudinal Studies
This is a longer-form research style where you collect data from the same source and conditions over a longer period. An example of this is medical studies that measure patients’ response to a drug over the long term.
Case Studies (storytelling or narratives)
You collect data from case studies to make empirical observations and draw inferences. This helps you understand the entire lifespan of a customer, including:
- Their key pain points
- Why they chose your product
- How they use(d) your product
- Why they would or would not recommend it to others.
What is data coding in qualitative research?
The easiest raw data to collate, analyze and summarize is quantitative data; however, we can still use thematic analysis when coding qualitative data to help us come to the same, if not more detailed, conclusion and summary. When you identify themes from your data, you can put your qualitative responses into buckets of similar feedback to dive deeper into areas of your business or offerings that really need help.
In qualitative research, “coding data” means assigning categories or values to each written or observed response. These values can then be added and averaged to determine an accurate overall representation of each area of your business that you are analyzing.
For example, you could ask one of two questions:
- Are you happy with your product or service? (Answers to include either yes/no or a satisfaction rating scale.)
- Tell us about your experience using our product. (The response is open-ended.)
When you ask the first type of question you’ll get a high-level “yes, we like your product” or “no, we don’t” type of response. While this data is helpful, it doesn’t indicate what it is about the product that people like or don’t like.
When you ask open-ended survey questions, you can get more detailed responses about why they’re satisfied or dissatisfied with your offering. They may point out a feature that doesn’t work as advertised (which you can now fix) or that the long wait time to reach a customer service rep through the chat box on your website has prevented them from using your product to its full potential.
Coding frameworks and methodology
Your methodology used for coding qualitative data will impact the level of detail and results you achieve. The more specific your qualitative data coding is, the more detail you’ll uncover.
Here are some common qualitative research coding frameworks:
Deductive coding
A deductive approach to coding qualitative data works best when you have sound foundational tags and categories in place. With deductive methods, you use the data you have to look for patterns, develop a hypothesis, and write your theory.
Deductive coding works great for annual survey data because you can use the same tags as the previous year as your benchmark and compare it to current results. You can also choose to combine your deductive coding with inductive coding.
Inductive coding
With inductive methods, you create a theory that you test, observe, and confirm. Inductive coding is best for your first round of analysis to help you determine the tags that’ll be of the highest value. This will be a lengthier process than deductive coding, but it’s an essential first step to getting the foundational data and labels you need for more in-depth coding and thematic analysis of your data.
Inductive coding also works best when you have scale measurements or are analyzing large amounts of qualitative data you haven’t analyzed before. Without qualitative coding software, it requires manually reviewing the data, which is why inductive coding takes so long.
Grounded Theory
Another way to code data is using a grounded theory. This is when you develop a theory based on data from a single customer. Your theory is “grounded” in real customer data, and you can test your theory by expanding your analysis to additional customers. This will help you determine if your theory is statistically applicable to a larger population of customers, or is an isolated case.
Hierarchical coding frames
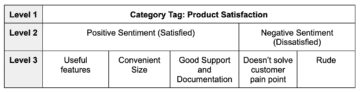
Your coding method can be as basic as determining a positive or negative sentiment towards a specific tag or category. It can also be tagged to understand specific reasons for that sentiment. There’s no right or wrong way to do this. It all depends on how much specificity and detail you want.
For example, when coding the sentiments of your product or service offering, Level 1 is the category tag you are analyzing. Level 2 is the sentiment (either positive or negative). The final level goes into more detail about why the respondent chose that sentiment. This is a tagset that you may not be able to create until you’ve analyzed at least some of the data (unless you already know this information from previous research, customer feedback, or grounded theories).
Examples of qualitative data coding
There are different ways of coding qualitative data. Here are some examples:
- In Vivo Coding: Coding is based on the participant’s words, not your own interpretation. For example, if the response includes emotional words to describe how they feel about your product, use those exact words as your tags.
- Process Coding: This helps understand people’s processes or steps. For example, if someone is describing how they use your software product to get their end result, they may explain actions (usually using “ing”) words. Use each “step” they describe as a tag to analyze the sentiment related to that step.
- Descriptive Coding: This analysis includes the analyst summarizing the response into a description. You then code the qualitative data based on a keyword or noun in that description.
- Values Coding: You take your qualitative data and create codes according to values, attitudes or beliefs.
- Simultaneous Coding: This is when a single open-ended response will correspond to several category codes. This is common in written testimonials and reviews. For example, a customer writes the following review: “I love this product. The features and customer support were outstanding.” This references an overall positive sentiment about the product and high ratings for the features and customer support. To capture this detailed data, this would be tagged with three predefined codes: product sentiment, product features, and customer service.
Steps for a qualitative data analysis
If you are coding qualitative data manually, there are three basic steps to code the data:
Step 1: Create high-level categories
Assign the categories of data you want to analyze. For example, if you’re doing an annual survey for the purposes of understanding customer sentiment and satisfaction with your company and its offerings, you may choose some of these tags (or others based on your type of business):
- Product features
- Staff
- Customer support
- Location
- Atmosphere
- Pricing
Step 2: Assign sentiments
To quantify qualitative data in this situation, apply a sentiment to each response. Start small and tag as either positive, negative, or neutral sentiments. At a fundamental level, people will either be happy, unhappy, or neutral about a feature or interaction with your brand.
Read each response and determine if this is a happy customer, a dissatisfied customer, or someone who doesn’t seem to care one way or the other. If you are unsure, code this answer as “Neutral.”
As you dive deeper into your data, you can expand on these three basic sentiments to make a full rating scale of responses which may, for example, include a rating scale for sentiment:
- Highly dissatisfied
- Somewhat dissatisfied
- Neutral
- Somewhat satisfied
- Very satisfied
Step 3: Combine and analyze
Now that you have finished the coding process and have assigned sentiments or ratings to your qualitative data, you can use this information to generalize your data and look for trends.
For example:
- If you notice that you have primarily negative sentiments, you can deduce that people are generally unsatisfied with your brand or offerings. Then you can read deeper into the data to see the areas they are dissatisfied with and make changes to increase customer satisfaction.
- If you notice people are indicating an indifference in their responses (mostly threes on your coding scale), perhaps these are customers who may leave soon because you’re not giving them the solution to their problem. You can analyze the data deeper to determine how to increase customer satisfaction to increase the Average Customer Lifetime value and duration, thus improving your sentiment scores in your next survey.
You can also combine your qualitative data results with any quantitative data you may have to provide a more detailed analysis of your survey results.
How do you code qualitative data in Excel?
Using spreadsheet software like Excel or Google Sheets for coding qualitative data works well due to the software’s built-in calculative abilities.
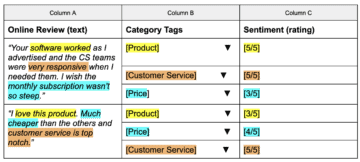
Here’s an example of how to code qualitative data based on written Google reviews in a spreadsheet:
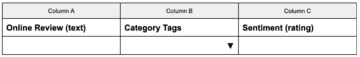
Step 1: Set up your spreadsheet
Start by adding your column headings to your spreadsheet. Basic qualitative analysis requires three columns. In this case, it’ll be your written Google review, the category tags you want to assign, and a sentiment rating or score.
We suggest starting with just 3-5 tags at the maximum to get started. For ease and consistency, use the dropdown list functionality in Excel (Data Validation in Google Sheets). Add a dropdown list of multi-select options for each category in Column B.
Your spreadsheet should look similar to this:
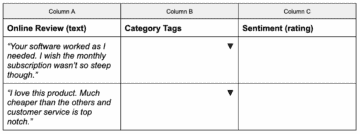
Step 3: Add qualitative data
Now you are ready to begin adding your Google reviews to the spreadsheet. Add one review per cell in Column A:
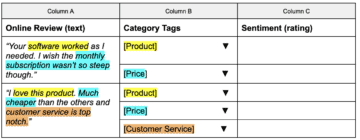
Step 4: Assign categories to data
In written responses like Google Reviews, one reviewer may mention several categories. For best results, highlight each category and include in the dropdown in column B:
Step 5: Assign sentiments
Assign each piece of feedback a sentiment using a rating scale of your choosing. We usually find that 1-3 (Unhappy, Neutral, Happy) works well, but feel free to expand that to a rating system of 5 if you want more granular feedback.
Step 6: Combine and average category ratings
Next, you want to look at each category individually to see which areas need improvement and which are performing well.
In the above example, calculate your average score percentage:
- Product Feedback: 5/5 + 3/5 = 4/5 average
- Price Feedback: 3/5 + 4/5 = 3.5/5 average
- Customer Service: 5/5 + 5/5 = 5/5 average
This tells us that your company has an excellent reputation for its customer service, but perhaps pricing could be improved to attract more customers. The product satisfaction rating is a good 80%, with room for improvement based on a deeper analysis of why customers don’t think your product is perfect.
Bonus tips for quantifying qualitative data
While collecting and interpreting qualitative data, here are some tips to ensure your results are as accurate as possible:
Start Small
It’s best to test your qualitative coding and analysis on small sample sets before dedicating more considerable resources to your research. Start with a couple of high level category tags and sample data and try your methods first. We suggest using 10-20% of your survey data for testing.
Use Scales
Consider ways to use rating scales when analyzing qualitative data rather than just recording sentiment. After all, humans are not just happy and sad for no reason. For example, if you get the response “I like the service, but feel it’s overpriced,” you could quantify that by either:
- They like the product (sentiment analysis)
- It’s a 3/5 because they don’t think this price is fair (scale analysis).
By using a scale, you now have quantitative data that you can average and summarize.
Track Multiples
Look at each question or dataset to see what other data you can infer or assume about the responses. For example, if you asked how they liked your restaurant’s food, they responded with, “It was tasty, but it could have been better if the waiter was more friendly.” This answer provides feedback on the food quality and the staff. Based on this, you can code their response into two categories with individual sentiments.
Limit Tags
Don’t overdo your tags and categories. You can use tags to go deeper into interpreting qualitative data, but unless you have the resources to analyze this level of detail, it likely won’t be helpful for you. Machine learning algorithms like Idiomatic and AI can help you analyze and summarize more tags and data.
Create tags based on themes, not wording
In most cases, the specific wording someone uses to describe your shop as dirty doesn’t matter. The fact that people think your storefront is filthy-looking is enough data to inform a business change or decision. People may describe “dirty” as dusty, grimy, or filthy, but they all mean the same thing.
When coding qualitative data like this, look for one word to encompass the sentiment of dirty, not each individual term used to describe it.
What is the fastest way to code qualitative data?
Qualitative data analysis software or machine learning algorithms and AI programs (like Idiomatic) are the fastest way to code qualitative data and present you with actionable results. It can also help you determine the more accurate tags and sentiment rules.
Idiomatic can take your qualitative data and use its robust machine learning algorithms to do the hard work for you. You can input any mix of research data into this qualitative coding software. Your qualitative data analysis is done in a machine-learned, systematic way to provide consistently reliable results every time you add new data.
To learn more about using Idiomatic as your qualitative data analysis software, request an Idiomatic demo today.