


Do you have quantifiable data that proves how happy (or unhappy) your customers are? How does their overall customer satisfaction compare to that of your competitors’ customers? That’s why many businesses, including two-thirds of Fortune 1000 companies, use Net Promoter Scores (NPS) to better understand customer satisfaction.
Businesses are also using this data to see how they can create more customer success by making changes to sales, marketing, product, and customer service systems.
In this article, we’ll introduce how to measure customer satisfaction and sentiment with NPS surveys, summarize industry NPS benchmarks, and share how you can improve your scores.
We will cover:
- What is NPS?
- How is NPS measured?
- How to analyze NPS data
- What’s a good NPS?
- NPS Benchmarks for 2022
- What’s a bad NPS?
- How many companies use NPS?
- How to improve your NPS
- Setting your own NPS benchmarks
- Predicting customer satisfaction with machine learning
- How to build a voice of customer program from scratch
Contents
- What is NPS?
- How is NPS measured?
- How to analyze NPS data
- What’s a good NPS?
- What’s a bad NPS score?
- NPS Benchmarks for 2022
- How many companies use NPS?
- How to improve your NPS score?
- Setting your own NPS benchmarks
- Predicting customer satisfaction with machine learning
- Building a Voice of Customer program from scratch
What is NPS?
Net Promoter Score (NPS) measures customer satisfaction and loyalty in B2B and B2C companies. NPS surveys measure customer loyalty with a series of questions, and the result is a score from -100 to +100.
How is NPS measured?
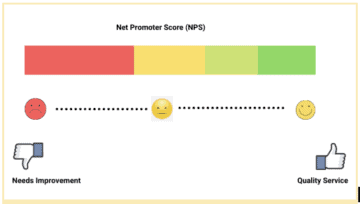
NPS is measured through responses to survey questions that collect customer feedback regarding satisfaction with certain aspects of your business. These answers are usually scales based from 0-10 (0 being unfavorable and 10 being favorable).
The 0-10 scale is broken down into 3 groups to indicate sentiments:
- Detractors (0-6): These are unhappy customers who can threaten your company’s growth through negative reviews and word of mouth.
- Passives (7-8): These are satisfied but unenthusiastic customers, vulnerable to competitive offerings.
- Promoters (9-10): These are your happiest, most loyal customers who will help your company grow through referrals, positive reviews, and word of mouth.
To calculate your overall net promoter score, you need to know the percentage of respondents who were promoters (scoring 9-10) and detractors (0-6). Then use the following formula to calculate your NPS score:
NPS = % promoters – % detractors
Read more: 18 NPS questions & how to increase response rate
How to analyze NPS data
In this video, we will show you how to turn your NPS feedback into actionable insights using Idiomatic Analysis. We will demonstrate how to analyze your NPS scores, identify the categories of issues affecting your scores, and drill down into specific feedback to understand the drivers behind detractors. By following these steps, you can focus your efforts on improving customer satisfaction and driving positive change.
Request a demo with your own NPS data
What’s a good NPS?
Every business and industry will share the same “acceptable” or average net promoter scores, as many factors come into play.
According to SurveyMonkey, the average net promoter score is +32 and the following ranges are the generally accepted ratings for bad or good NPS:
- -100-1: Lots of room for improvement
- +0-30: Acceptable average range, with clear space to grow
- 30-50: You have more happy than unhappy customers
- 51-69: Excellent, above-average score
- 70+: Outstanding! You have a largely happy and loyal customer base.
However, knowing your NPS score isn’t helpful if you don’t use this data to improve your business to earn more loyal and happy customers. By understanding how and why people are rating your business as they are, you can improve your NPS score over time. Machine learning systems can help you predict and understand NPS scores at a deeper level so you can take action.
Read more: What is a good NPS score?
What’s a bad NPS score?
The term “bad” is relative in this case. However, a negative score (-100 to 0) means you have more dissatisfied customers than satisfied ones. On the other hand, if a company that usually sees +70 NPS scores is scoring +50, that could be seen as a “bad” score for them, even though +50 is widely regarded as a good NPS score).
Here are some factors that may help you determine if you’ve received a “bad” NPS score:
- If it’s lower than similar businesses in your niche
- If it’s lower than your past NPS scores
- If it has a significant, unexpected drop in score.
However, getting a “bad” score isn’t necessarily bad. Collect and analyze the data correctly, and you can use this valuable customer data to improve your business to boost your next NPS score, and earn more happy, loyal customers.
NPS Benchmarks for 2022
The more niche-specific your NPS benchmark data is, the better you can see how you’re faring in the market.
Below indicates some recent 2022 insights and key NPS benchmark data to consider when analyzing your NPS score. This data takes publicly available NPS data scores, categorizes them by industry or niche, and takes the average scores or ranges for each to develop a benchmark.
SaaS Companies
Your Software as a Service (SaaS) company should strive for +31 or higher in an NPS score. The industry average is between 31 – 41 and is often impacted by seasonal trends. Here are some representative B2B businesses and NPS benchmarks in 2022:
- B2B Software and SaaS: +40
- Cloud & Hosting: +25
- E-commerce: +62
- Internet Software and services: +4
Company examples: In August 2022, Google’s NPS was +58. YouTube scored +49.
B2B Companies
Business to Business (B2B) businesses should expect a slightly higher benchmark NPS score of +41 or more but typically range between +3 and 62. Here are some representative B2B businesses and NPS benchmarks in 2022:
- Consulting Businesses: +68
- Technology services: +61
- Digital Marketing Agencies: +60
- Construction: +45
- Logistics and Transportation: +43
Company examples: In July 2022, American Express Bank’s NPS was +52, but Morgan Stanley’s score was +16.
B2C Companies
Business to Consumer (B2C) businesses see a similar average NPS score of +47, but range from 24-57. Based on the data, “consumers” are harder to please and there is a wider range of benchmark scores. Here are some representative B2C businesses NPS benchmarks in 2022:
- Insurance: +71
- Retail: +61
- Financial Services: +56
- Healthcare: +38
- Communications and Media: +29
Company examples: Lululemon typically sees an NPS of 30-40 but fluctuates depending on the time of year. However, Starbucks, which is a more year-round business, stays steady around +40.
How many companies use NPS?
Not every business uses net promoter scores to measure overall customer satisfaction and sentiment. However, as of 2020, A Fortune article estimated that nearly two-thirds of all Fortune 1000 companies use it.
It’s often something that smaller businesses feel is too much (or too expensive) to do, but that is largely incorrect. All you need to do is ask your customers a one-question NPS survey:
“Would you recommend our company to others?”
Tesla’s high NPS score
Tesla has some of the happiest, most loyal customers in the world. As of 2022, Tesla’s NPS score was +97. Bloomberg reported that 99% of Tesla customers would recommend this car maker to their friends. This level of customer loyalty is largely unheard of in any industry.
We have no doubt they’re pretty happy with a 97 net promoter score, but even if they compared it to consumer automotive industry benchmarks and other competitors in that market, they rise far above:
- Honda: +82
- Toyota: +43
- Harley Davidson: +52
- Rolls Royce: +47
Their high NPS score is likely attributed to:
- Having an excellent product that meets customer needs
- Greater transparency and honest communication
- Quick response to customer feedback
- Personalized, easy online buying experience
Netflix adapting to raise NPS scores
When Netflix first started, it was a mail-in DVD-rental service. People would order DVDs online and have them shipped to their houses. When they were done, customers would ship them back and receive a new one from their wish list. As DVDs were declining in popularity, they very likely used customer sentiment and NPS surveys to see that this business-delivery model wouldn’t serve the needs of their customers anymore.
Today Netflix has the most popular online media streaming service in the world and has earned a comfortable +67% NPS score. By changing how they deliver entertainment (from DVDs to streaming online), they’re better meeting the needs of their consumers and evolving technology. They earned such high customer loyalty that their average churn rate in 2021 was just 2.4%. But just as a company can positively affect churn, the opposite can quickly happen. As of March 2022, Netflix’s churn rate increased to 3.3%, which correlated with an increase in subscription prices. We’re willing to bet their NPS score has also declined, due to this business decision.
Read more: Customer Churn Prediction Using Machine Learning_
Pinterest increasing 5-star ratings
Popular social bookmarking website Pinterest also used customer satisfaction data to inform business decisions, ultimately leading to a 4% point increase in 5-star app ratings and an 83% decrease in complaints.
They used customer data sources like surveys, support center data, and Idiomatic machine learning platform to better understand where their customers were struggling or most dissatisfied. With these valuable insights, they were able to make changes to see a dramatic change in customer satisfaction and brand loyalty.
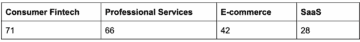
Average NPS Scores by industry
How to improve your NPS score?
Because your NPS score only tells part of the story, knowing how you compare to others in your niche can help you beat your competitors. Many NPS scores are published in online databases, making it easy to find comparable businesses to benchmark against.
When you have your NPS scores, it’s important to look at the detail they provide to understand how to best respond or react to improve these scores. For example:
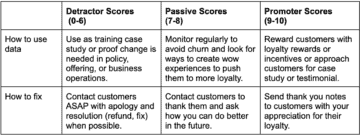
In addition, you can use insights from your NPS data to improve your customer service:
- Focus on customer-centric processes: A low net promoter score means your customers are not generally happy or loyal to your company or its products and services. You will need to win them over again by making changes to better meet their needs. Approach business changes from a more customer-centric lens to earn their loyalty back.
- Humbly take criticism: It’s hard for many of us to accept that people don’t like us, especially in business. Humbly accept and read any complaints you get through NPS surveys and use that information to make changes to correct problems and boost the user experience based on your common customer feedback.
- Support customer-facing teams: Often, low NPS scores are related to a bad experience a customer has with a front-line staff member (sales, support, help desk…etc.). Use the feedback from an NPS survey as case studies for customer-facing staff, so they know how to appropriately respond to the customer. For example, with the help of Idiomatic, Upwork increased its Net Promoter Score by 3% by pulling automatic insights from customer feedback to improve support operations without manual analysis.
Setting your own NPS benchmarks
NPS scores are not a one-and-done process. It’s something that should be calculated and tracked over time. This will help you uncover trends and uphold an acceptable standard of customer service.
Develop your own benchmark (or goal) based on NPS industry benchmarks, your historical NPS scores, and what you feel is an acceptable, internally acceptable standard to uphold.
For example, you may discover that your industry standard NPS benchmark is +32. Your business has only been in operation for two years and is a relatively new player in the market. You’ve been averaging +10 to +15 NPS scores over the past 12 months. Your team may determine this is an acceptable customer satisfaction score for now, but you want to see continual growth over the next 3 years. You set a goal to reach the +32s (+/- 5 points) within 3 years.
Predicting customer satisfaction with machine learning
Collecting data is often the easy part of the Net Promoter Score process. Next, you need to take the data and insights and translate those into sentiments and detailed customer feedback so you know where your unhappy customers are and what you can do to earn their support and loyalty.
Machine learning algorithms, like those Idiomatic uses, can help you take massive amounts of data and turn them into actionable insights based on customer feedback and sentiment. With Idiomatic, you can identify the specific product and operational changes that will most improve your NPS score and monitor the impact of making those changes. This can help you outperform your competitors and provide a better customer experience.
Curious how Idiomatic can be used with your customer feedback data and NPS survey results? Request a demo of Idiomatic today.
Building a Voice of Customer program from scratch
If you’d like to go beyond NPS and build a Voice of Customer program from scratch, here’s a video about how Idiomatic’s platform unlocks the full power of your customer feedback to make building VOC a breeze.